At Bondo Advisors we have spent several years advising on the sale and acquisition of software and SaaS companies. Over that time we have participated in sale processes with strategic buyers, rollups and private equity funds, both in Spain and in cross-border transactions with European and American acquirers.
This article summarises what we see in every process: how buyers think, what data they analyse, and what factors truly determine the price of a software company. It is not an academic exercise. It is a description of what actually happens in practice.
1. Why SaaS companies are valued differently
Most company sale transactions use an EBITDA multiple as the basis for valuation. This makes sense: EBITDA approximates operating cash generation, and the buyer is paying for the capacity of that business to generate money in the future.
SaaS companies have an important particular characteristic. Many of them are not profitable at the time of sale, or have very low EBITDA margins. Applying an EBITDA multiple to a company that generates little or no operating result would produce an absurd valuation, or would simply not be applicable.
Does that mean those companies have no value? Not at all. What is happening is that the buyer is looking at something else: the cash flows that company will be able to generate over the next three to five years, once it reduces its pace of investment in growth.
This is the most important distinction a founder needs to understand before starting a sale process.
The lack of profitability has to be a choice, not a consequence.
If a SaaS company is investing heavily in sales and marketing to grow at 40% per year, and that growth is reflected in solid retention and customer expansion metrics, the buyer can model with reasonable precision when and how much that company will generate once it moderates its acquisition investment.
If on the other hand the company is not growing, is losing money, and its customer base does not retain well, there is no ARR multiple that will sustain an attractive valuation. A sophisticated buyer will detect this in the first days of due diligence.
The simplest test for a founder: if you completely eliminated your sales and marketing spend for twelve months, would your business be profitable? If the answer is yes, you have a healthy model that is investing in growth. If the answer is no, there is a structural problem that needs to be resolved before thinking about a sale.
2. The ARR multiple: what it is and what determines it
ARR (Annual Recurring Revenue) is the sum of all annualised recurring revenues of a SaaS company. It does not include one-off revenues, projects or non-recurring services.
In the European mid-market, which for a SaaS company in Spain typically corresponds to an Enterprise Value of between 10 and 50 million euros, the ARR multiples observed in transactions usually range between 2x and 8x ARR, with exceptional cases that exceed this range in very high-growth companies.
The ARR multiple is not an arbitrary metric. It is the way the buyer expresses their estimate of the present value of the company’s future cash flows, adjusted for the risk they perceive in those flows.
Two companies with the same ARR can have very different valuations. A company with 3 million euros of ARR growing at 40% per year, with an NRR of 115% and gross margins of 75%, is a fundamentally different business from one with 3 million euros of ARR growing at 8% per year, with an NRR of 88% and margins of 55%. The buyer will pay very different multiples for each of them.
What moves the multiple is the combination of growth, retention and margin quality. There is no single formula, but there is an analytical framework that all sophisticated buyers use.
3. The Rule of 40
The Rule of 40 is one of the most widely used indicators in the SaaS market to evaluate the balance between growth and profitability of a company. Its formulation is simple:
ARR growth rate (%) + EBITDA margin (%) ≥ 40
The logic behind this indicator is that a healthy software business should be able to combine growth and profitability such that the sum of both exceeds 40. It does not matter how that sum is distributed: it can come primarily from growth, primarily from profitability, or from a combination of both.
Some concrete examples:
A company that grows at 50% per year and has an EBITDA margin of -10% achieves a Rule of 40 of 40. It is an attractive business for a buyer: growth is high, the loss is moderate and is presumably funded by investment in customer acquisition.
A company that grows at 15% per year and has an EBITDA margin of 25% also achieves a Rule of 40 of 40. It is a different profile, more mature and profitable, equally attractive although for a different universe of buyers.
A company that grows at 10% per year and has an EBITDA margin of -15% achieves a Rule of 40 of -5. This is the scenario that buyers avoid: low growth and simultaneous losses. In this case the sale process will be very difficult or will result in a valuation well below the founder’s expectations.
The message is clear: you can grow fast and lose money, or grow slowly and be profitable. The combination of low growth and losses is what destroys value in a transaction.
4. The KPIs that a sophisticated buyer analyses
When a serious buyer receives the teaser for a SaaS company, the first thing they request after signing the NDA is the detail of the operational metrics. Presenting the revenue figure and EBITDA is not enough. A sophisticated buyer wants to see the full picture.
Below we explain the ten indicators that form part of any rigorous analysis, with their formulas and the ranges that in our experience make the difference between an attractive company and one that raises doubts.
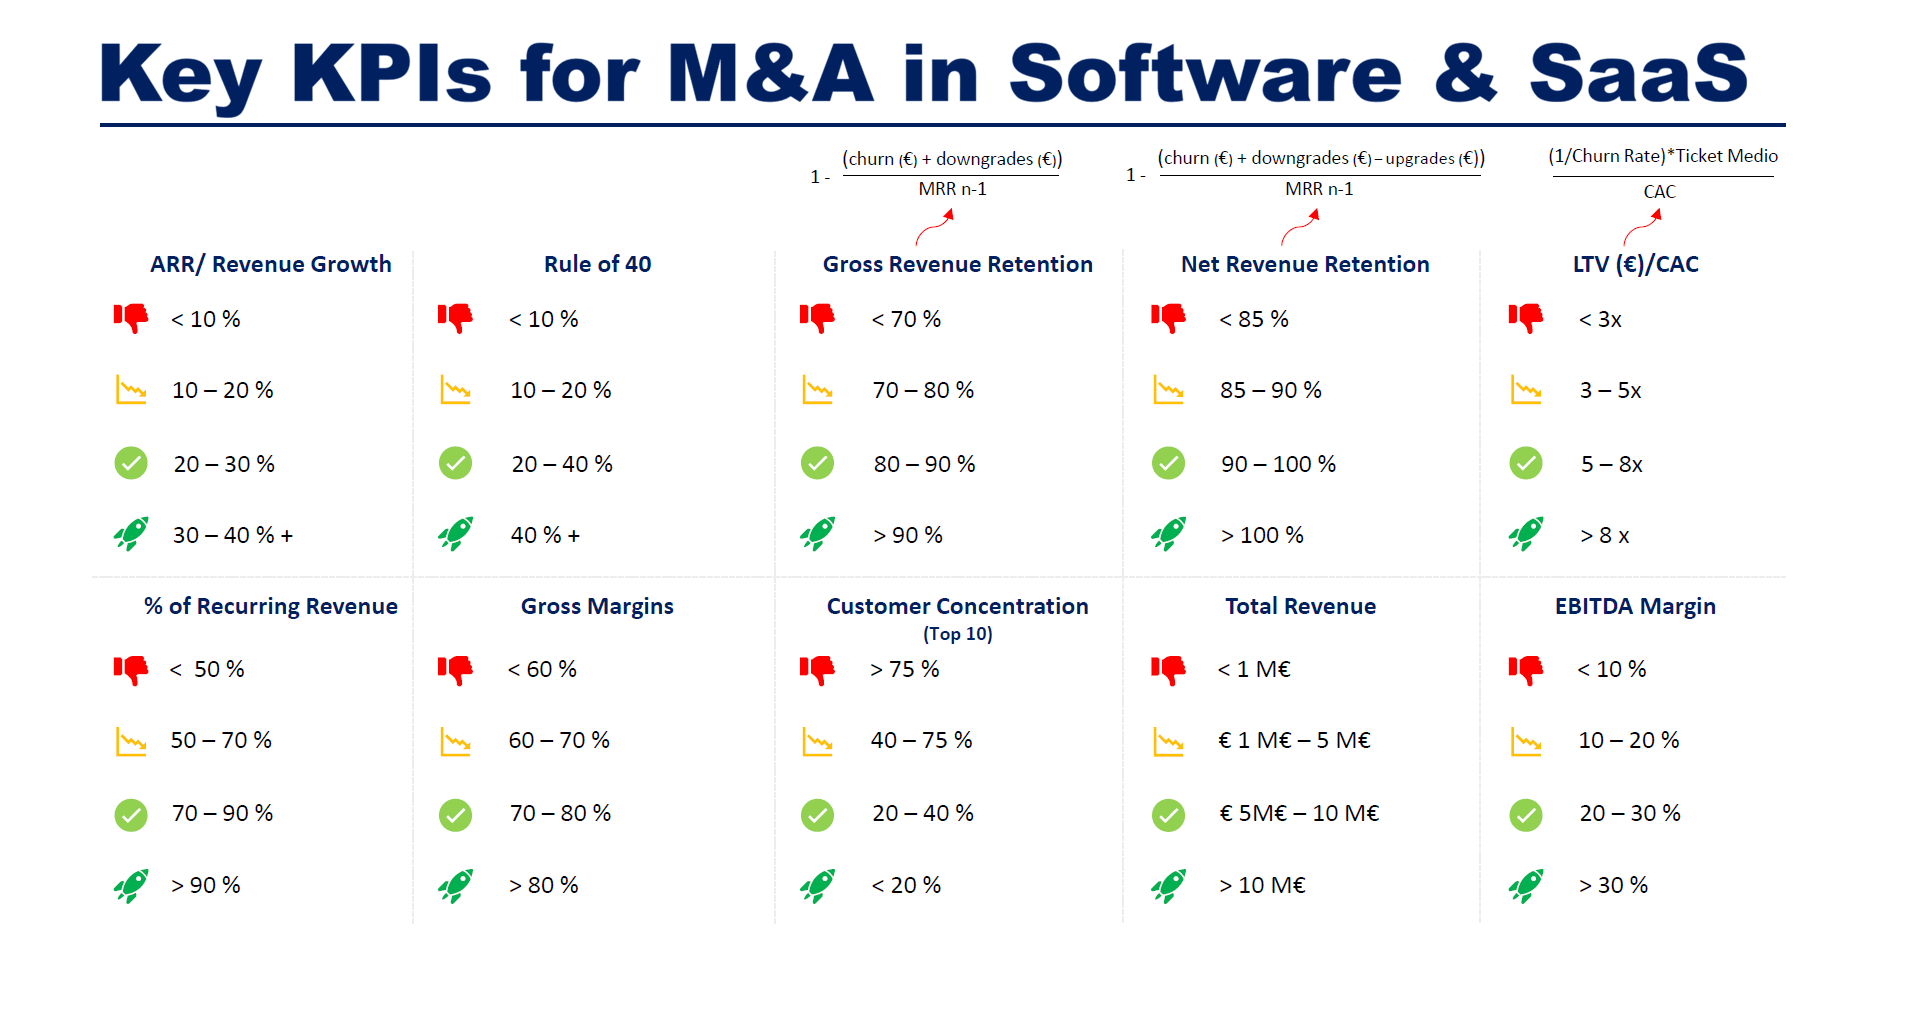
ARR / Revenue Growth Measures the rate at which the business is growing. It is the most direct signal of market demand. Growth below 10% in a company that is not yet profitable is a serious warning sign. Growth above 30% places the company in a high-attractiveness category for growth-profile buyers.
Rule of 40 The combined thermometer described in the previous section. Below 10, the company will have difficulty generating buyer interest. Above 40, the company is in an advantageous position in any negotiation.
Gross Revenue Retention (GRR) Measures what proportion of the previous year’s revenues is maintained in the current year, not counting expansion of existing customers.
GRR = 1 – (churn in euros + downgrades in euros) / MRR of the previous period
A GRR above 90% indicates that customers who join tend to stay and that the product has high perceived value. Below 70%, the business has a structural retention problem that no pace of acquisition can compensate for indefinitely.
Net Revenue Retention (NRR) Goes one step further than GRR. It measures whether existing customers spend more over time, incorporating both cancellations and reductions as well as expansions.
NRR = 1 – (churn in euros + downgrades in euros – upgrades in euros) / MRR of the previous period
An NRR above 100% is one of the most valued signals in any SaaS company. It means that even if the company acquired no new customers over the next twelve months, its revenues would continue to grow. For a buyer, that is visibility of future revenues with very low risk.
LTV / CAC Compares the lifetime value of a customer with the cost of acquiring them.
LTV/CAC = (1 / Churn Rate × Average Ticket) / CAC
A ratio below 3x indicates that the acquisition model is not efficient: too much is being spent to acquire customers who do not generate sufficient long-term value. A ratio above 8x indicates a business with a very efficient growth engine.
Percentage of recurring revenues How much of total revenues is ARR versus one-off or service revenues. In a company presenting itself as SaaS, a percentage of recurring revenues below 70% raises questions about the true nature of the business model. Above 90% is the cleanest profile for a transaction.
Gross Margins Gross margins in SaaS measure how much remains after the direct costs associated with delivering the service: infrastructure, hosting, first-level support. In a pure SaaS, gross margins should be above 70%. Below 60%, the buyer will start to question whether the model has sufficient operating leverage to be attractive at scale.
Customer Concentration Measures the risk of dependency on a few customers. If the ten largest customers represent more than 75% of ARR, the company has a concentration risk that any buyer will incorporate into the price or the contract conditions. The ideal situation is that no single customer exceeds 10-15% of total ARR.
Total Revenue The absolute size of the business determines what type of buyers may be interested. Below 1 million euros in total revenues, the universe of institutional buyers is very limited. Above 10 million, the company can attract interest from mid-market private equity funds and international strategic buyers.
EBITDA Margin Even when negative, the buyer wants to understand the trajectory. A company that has moved from an EBITDA of -30% two years ago to -10% today has a story of operational improvement that supports the investment thesis. A company that has maintained the same level of losses for three years with no visible improvement raises doubts about the management team’s ability to control costs as it scales.
5. The regression valuation model using public comparables
One of the methodologies for estimating the value of a private SaaS company consists of observing the behaviour of comparable listed companies and building a relationship between their valuation multiples and their operational metrics.
The process has five steps.
Step 1: Select the comparable universe Software and SaaS companies listed on public markets are identified with a comparable profile in terms of sector, business model and size. For a Spanish Digital Marketing SaaS company, the universe could include companies listed on the Nasdaq, NYSE Euronext or the London Stock Exchange with similar models.
Step 2: Map each company by Rule of 40 For each company in the universe, its current Rule of 40 and its valuation multiple on recurring revenues or EV/Revenue are calculated. The result is a set of points distributed on a chart with Rule of 40 on the horizontal axis and the valuation multiple on the vertical axis.
Step 3: Build the regression line The correlation between Rule of 40 and valuation multiple in listed SaaS companies is statistically robust. Companies with a higher Rule of 40 receive higher multiples. The regression allows the implicit multiple corresponding to any value of Rule of 40 to be estimated.
Step 4: Read the implicit multiple for the company being analysed Once the regression line is built, the Rule of 40 of the company to be valued is entered and the multiple that the listed market would be willing to pay for a business with those metrics is obtained.
Step 5: Apply the private company discount Listed companies have a liquidity premium that private companies do not. An investor who buys shares on the stock exchange can sell them at any time. A buyer of a private company assumes a significantly greater liquidity risk. For this reason a discount is applied to the listed multiple, which in practice ranges between 20% and 40% depending on market conditions, the size of the company and the profile of the buyer.
An illustrative example: if the regression with listed companies indicates that a company with a Rule of 40 of 35 should trade at 6x ARR, and a 30% discount is applied for private company illiquidity, the indicative valuation in the private market would be around 4x to 4.5x ARR.
This model has important limitations. Listed markets fluctuate with the macroeconomic cycle and interest rate conditions, which means that reference multiples can vary considerably from one year to the next. In addition, the private discount is not a fixed figure but depends on multiple transaction-specific factors.
However, it is the most objective framework available for anchoring a valuation conversation with real market data, rather than relying solely on private transaction comparables which by definition are more scarce and less transparent.
6. The preparation process: data, KPIs and the Information Memorandum
A good valuation is not obtained simply by having good metrics. It is obtained by being able to demonstrate them with clean, well-structured and auditable data.
At Bondo Advisors, an essential part of our work before starting any sale process is to prepare a complete data package that accompanies the Information Memorandum. This package includes two elements: the detail of the raw data behind each KPI, and the Excel model that shows how that data is transformed into the indicators and how they connect to the profit and loss account.
Sophisticated buyers do not just want to see the result. They want to access the underlying data and work with it. A buyer who receives a metrics table without the data that supports it has less confidence in the numbers, asks more questions and takes longer to reach an offer. A buyer who can open the Excel, follow the logic and reproduce the calculations moves much faster and with greater conviction.
Our experience has taught us that building that data package is rarely as simple as extracting information from the ERP or billing system. In practice situations arise that complicate the analysis and need to be handled carefully to arrive at the correct figure:
- Changes in legal entity name: customers who have changed their company name over time and appear in the system as different customers when they are in fact the same contract.
- Corporate groups with centralised billing: all billing goes to a single entity but corresponds to independent contracts with separate business units, each with its own renewal cycle and its own purchasing decision.
- Discontinued modules and services: in the upselling analysis, modules appear that no longer exist, have changed name or have been integrated into another product, which requires manually reconstructing the historical data to make it coherent over time.
- Changes in the billing model: services that have been billed differently in different periods, which means that data from one year is not directly comparable with data from the previous year.
Handling all these cases correctly is not a minor task. It is precisely the work that makes the difference between KPIs that a buyer accepts and KPIs that generate doubts, questions and delays.
In addition to data preparation, there is another factor that significantly influences the final valuation: finding the right buyer.
In the case of strategic buyers, the price a buyer is willing to pay does not depend only on the metrics of the company being sold. It also depends on the synergies that specific buyer can obtain:
- Access to a complementary customer base: the buyer expands their portfolio without having to build it from scratch.
- Elimination of a competitor: the acquisition strengthens their market position and consolidates market share.
- Technology acquisition: incorporates capabilities that would save them years of internal development.
- Entry into a new geographic market: the acquired company is the key to a territory where the buyer has no presence.
When the buyer for whom the company has the greatest strategic value is identified, the multiples that can be achieved are significantly higher than those that would result from a process with generic buyers. Part of our work at Bondo is to identify that universe of potential buyers, understand the value logic of each of them, and structure the sale process so that competition among buyers reflects the true value of the company for each party.
If you are thinking about a sale in the next one or two years, the moment to start preparing is not when you decide to launch the process. It is now. You can contact us for an initial conversation with no commitment.